Delhi's Air IQ
Delhi is the now the most polluted city in the world. During a particularly foul spell of air pollution I decided to make some forays into data analysis and in the process, stumbled upon some interesting insights. As always, it starts withs a histogram
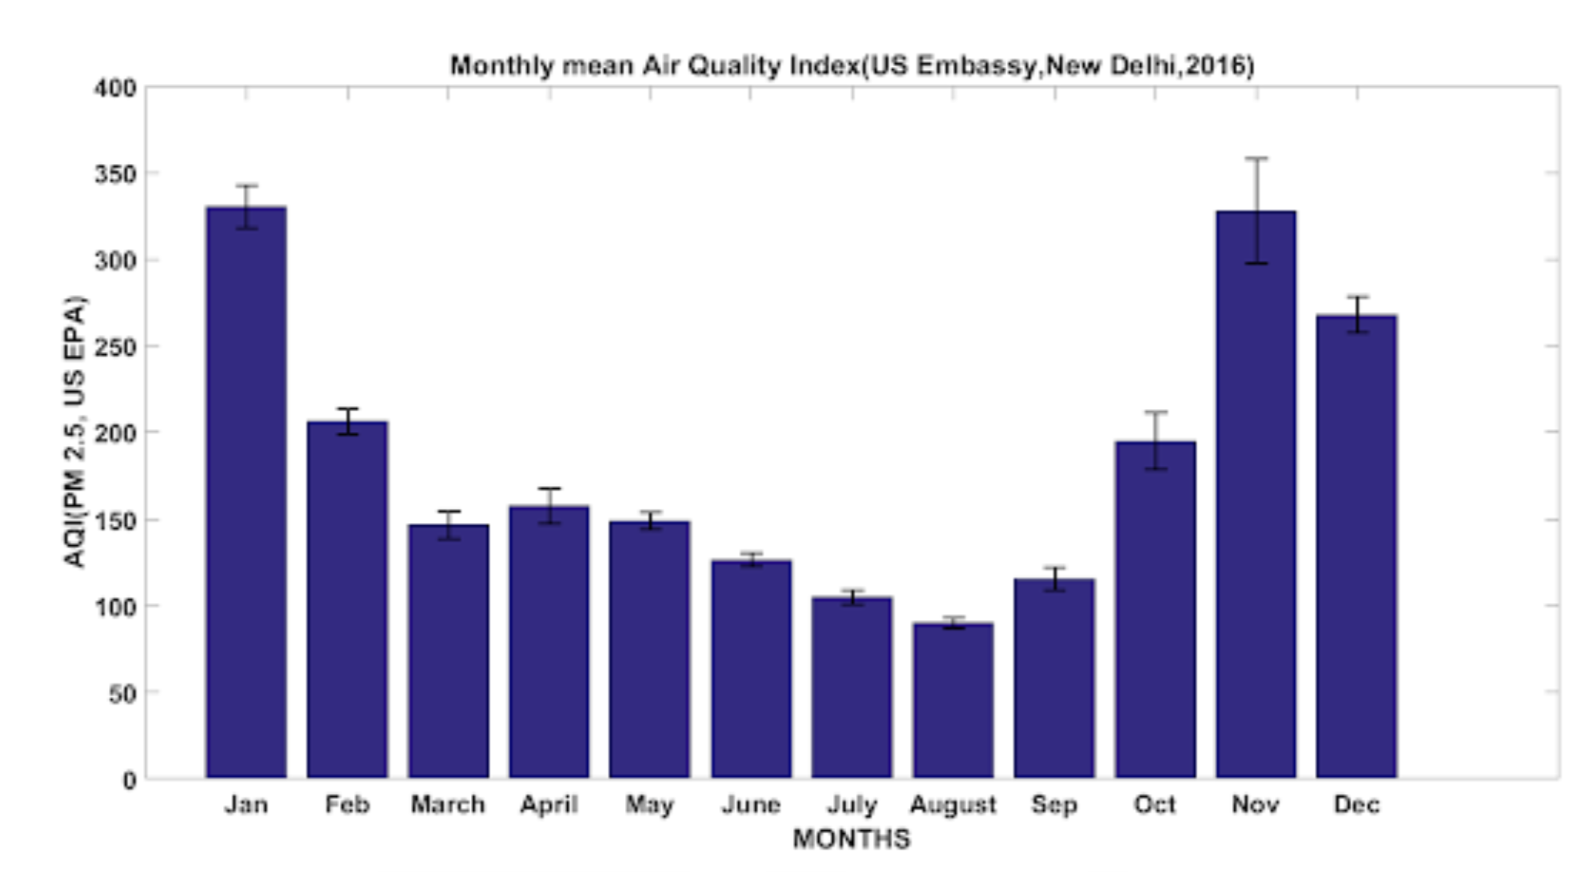
Figure 1. confirms what common people know from lived experience; the AQI is at its best in the monsoon months July-September, with August being the cleanest. The city’s air is at its worst in the winter months November-January- though surprisingly, there is a small but marked improvementin air quality in December before plummeting again to November levels in January. This could possibly be the effect of thermal inversion.
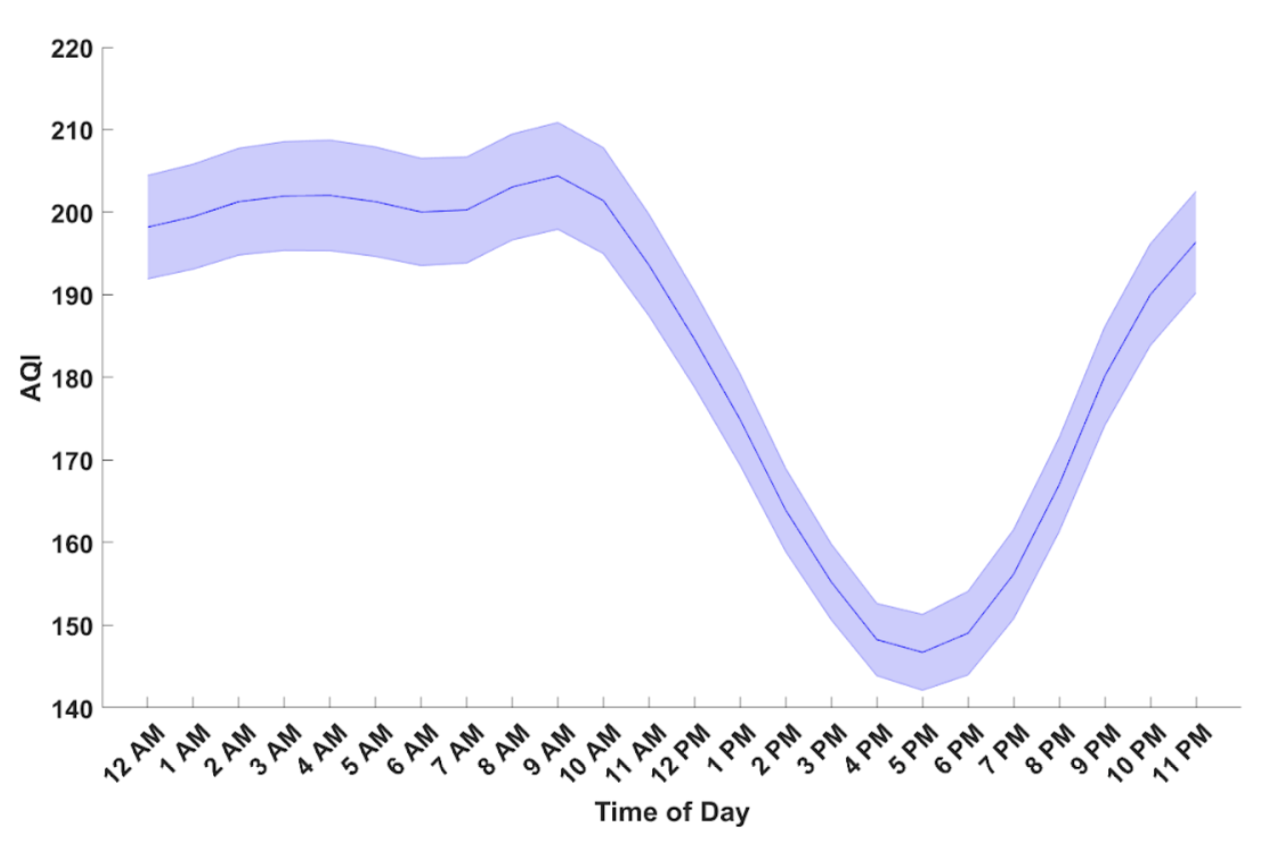
Figure 2. Indicates that the cleanest AQI is to be found in the evening from 4-6 PM. This may run counter to the intuitions of some. For example, a poll conducted by smart air found that most respondents believed the air to be the cleanest in the night.
For more see - https://smartairfilters.com/en/blog/when-is-pm2-5-the-lowest/
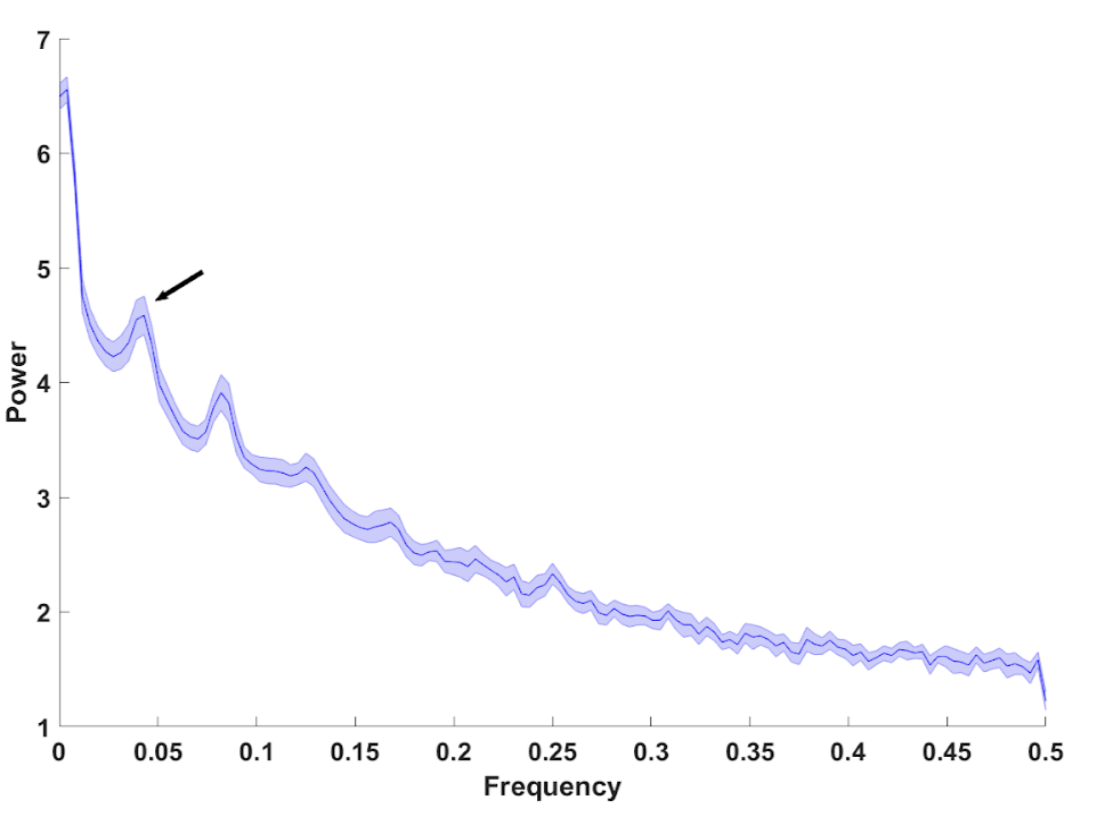
Figure 3. Is the power spectrum of the AQI time series.The peak indicated by the arrow corresponds to a frequency ~ 0.4.This means that the hourly AQI data may be considered to be a somewhat periodic signal with a frequency roughly of 1 cycle every 24 hrs. The sun, in other words, exerts a powerful influence on air quality.
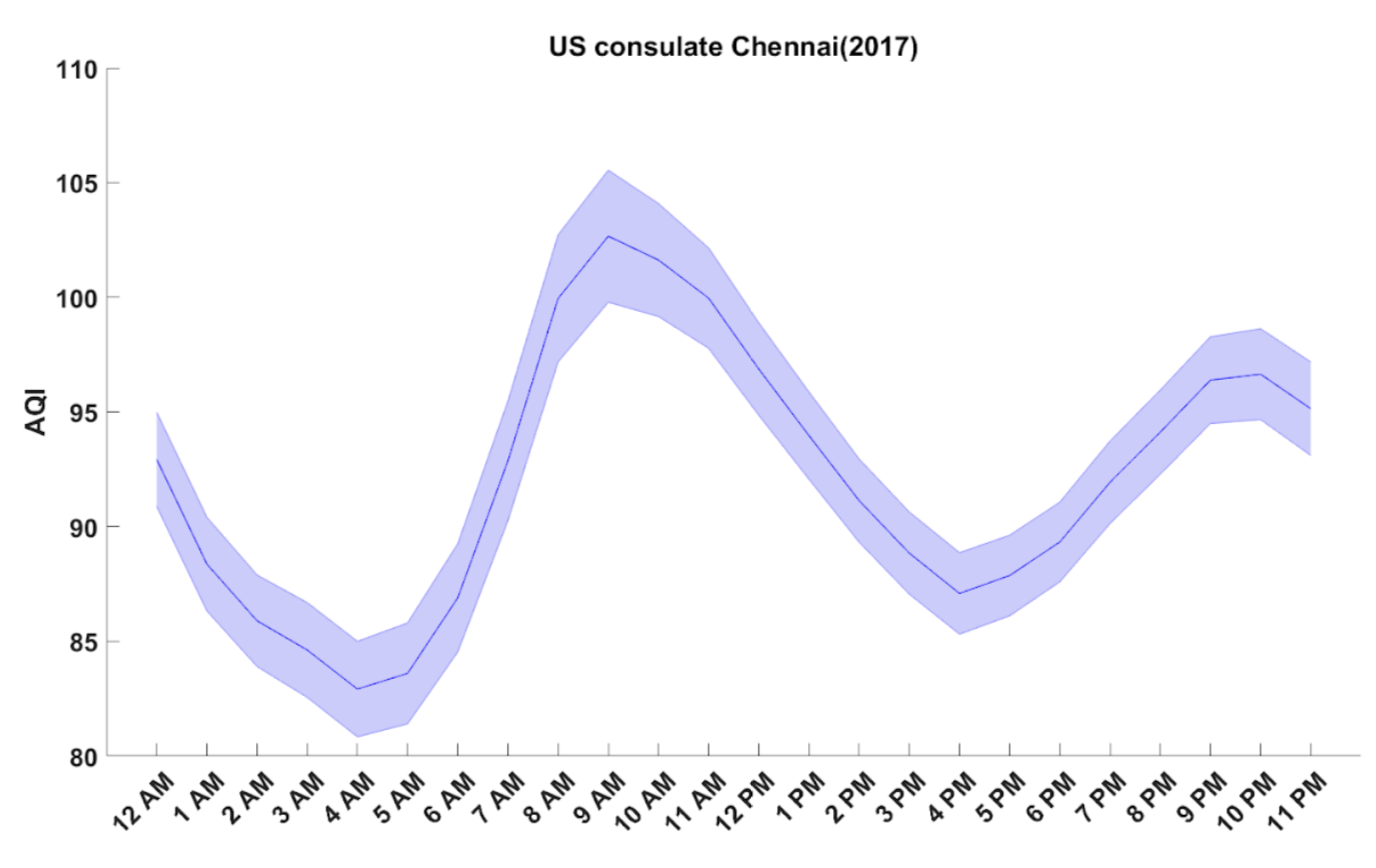
Figure 4. Shows the hourly changes in AQI for Chennai. The figure suggests that in addition to the late afternoon dip in AQI, Chennai also experiences another dip in the early morning hours(~ 4AM). This could be due to land breeze effect.
To be continued……..
DATA:
Hourly US EPA AQI(PM 2.5) recorded at the US embassy at Chanakya Puri, New Delhi, India for the year 2016. All data is freely available as csv from the US embassy website(https://in.usembassy.gov/embassy-consulates/new-delhi/air-quality-data/)