Neural Cross frequency coupling
Recent years have seen an explosion in articles that claim to have ‘discovered’ novel cross-frequency interactions in different parts of the brain under various task conditions. While the enterprise is not flawed in and of itself, many signal processing constraints make reliable estimation of cross-frequency interactions a vexing task, frought with methodological pitfalls. One such pitfall is the implicit(and flawed) assumption that all neural waveforms are inherently sinusoidal( sin, cos and linear mixtures thereof), when in reality, neural time series display all kinds of complex, non-sinusoidal waveforms.
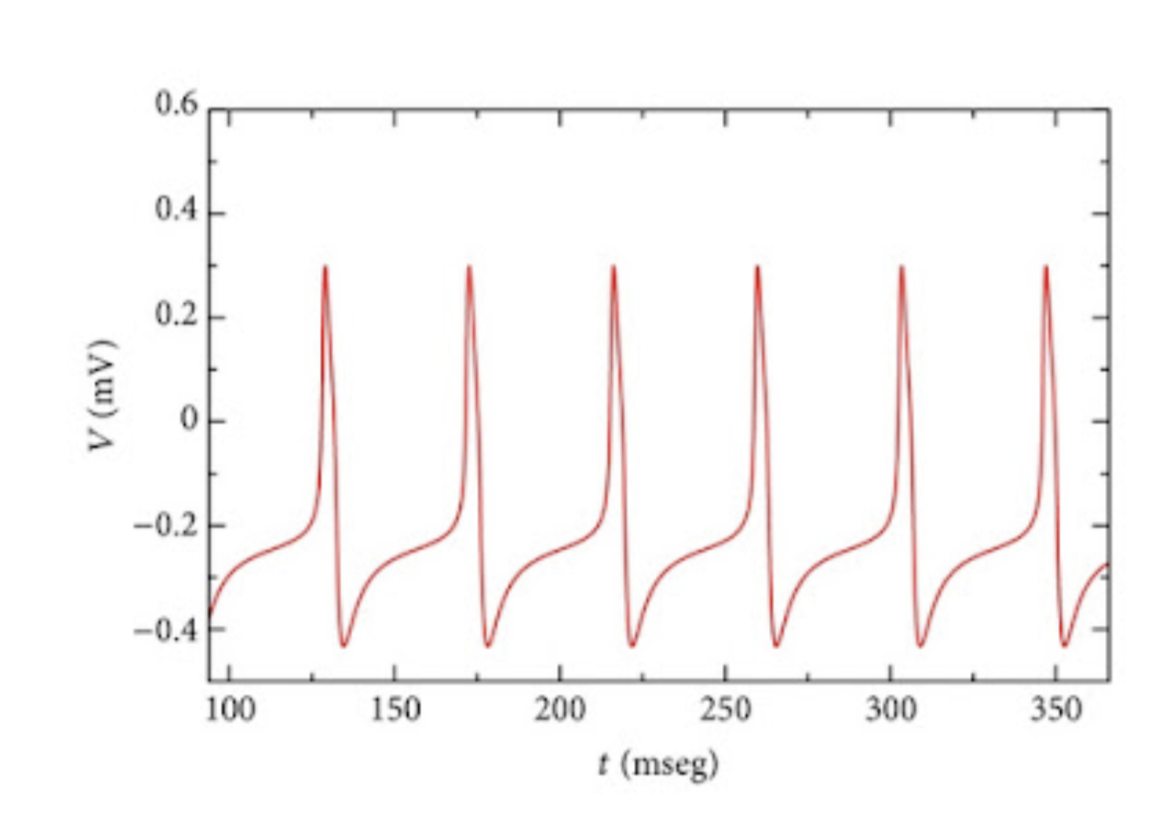
The fact that most neural oscillations are not perfect sinusoids should be hardly surprising. Afterall, what we see as a neural trace is really the outcome of a high dimensional dynamical process. One mechanism through which an oscillation emerges in such systems is through the creation of a limit cycle. Therefore, an oscillatory waveform corresponds to the shape of a limit cycle in the phase space. For example, the following figure represents the spike morphology of the Morris-Lecar neuron-
This point can be further explored using the Van Der Pol oscillator, which is a prototypical non-linear limit cycle oscillator. The following equations correspond to the dynamics of the VdP oscillator-
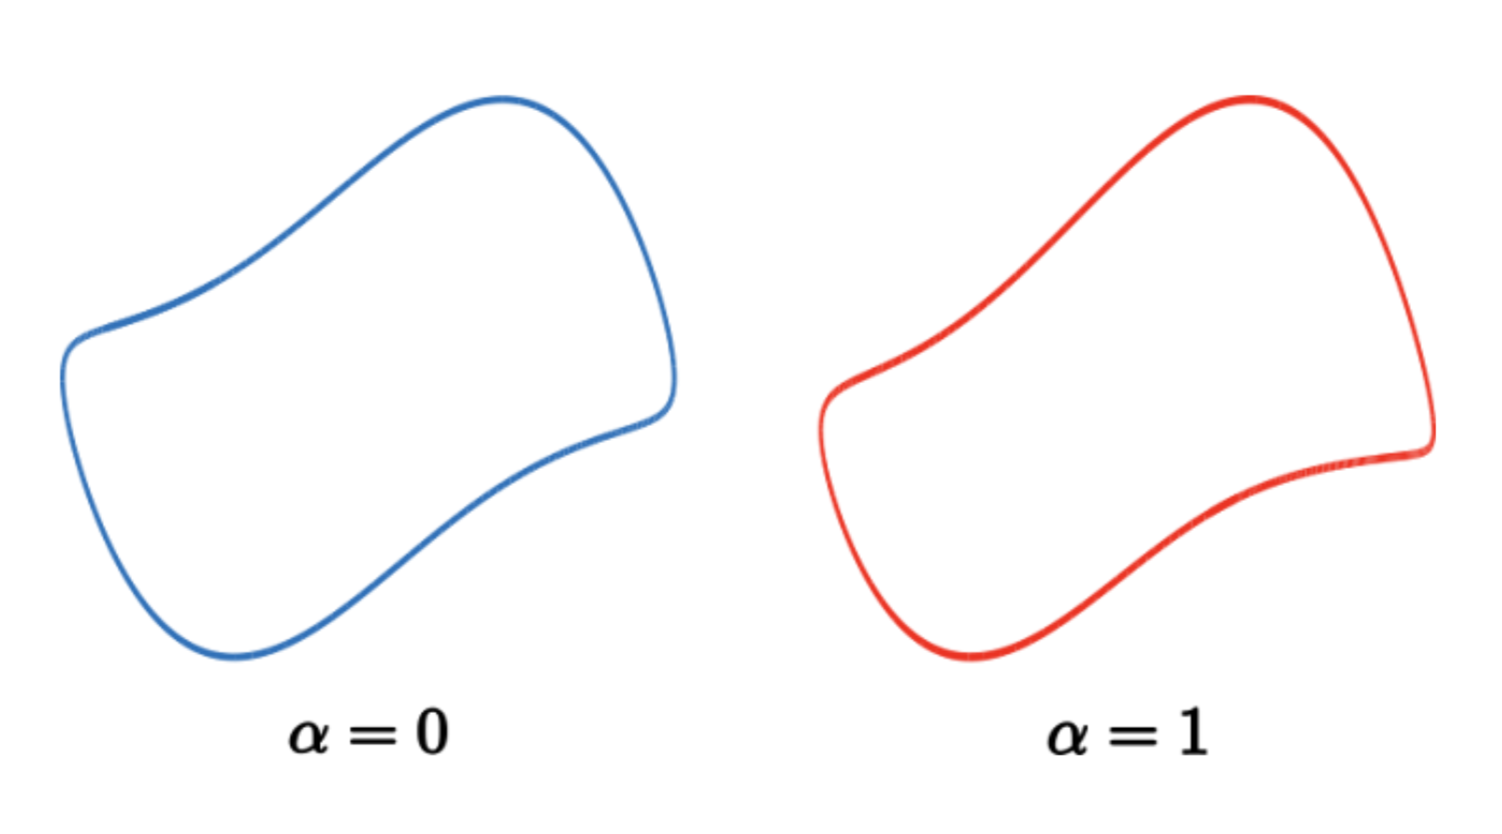
\[\ddot{x} - \mu(1-\alpha x - x^{2})\dot{x} + kx = 0\]Reducing the 2nd order differential equation into a set of coupled first order differential equations lets us solve the system numerically. Just like the morris-lecar equations, the VdP system possesses a limit cycle which deviates substantially from a perfect sinusoid. The parameter $\alpha$ is an interesting one. By changing $\alpha$ we can change the shape of the resulting limit cycle like so -
Following is the power spectra of the resulting time series -
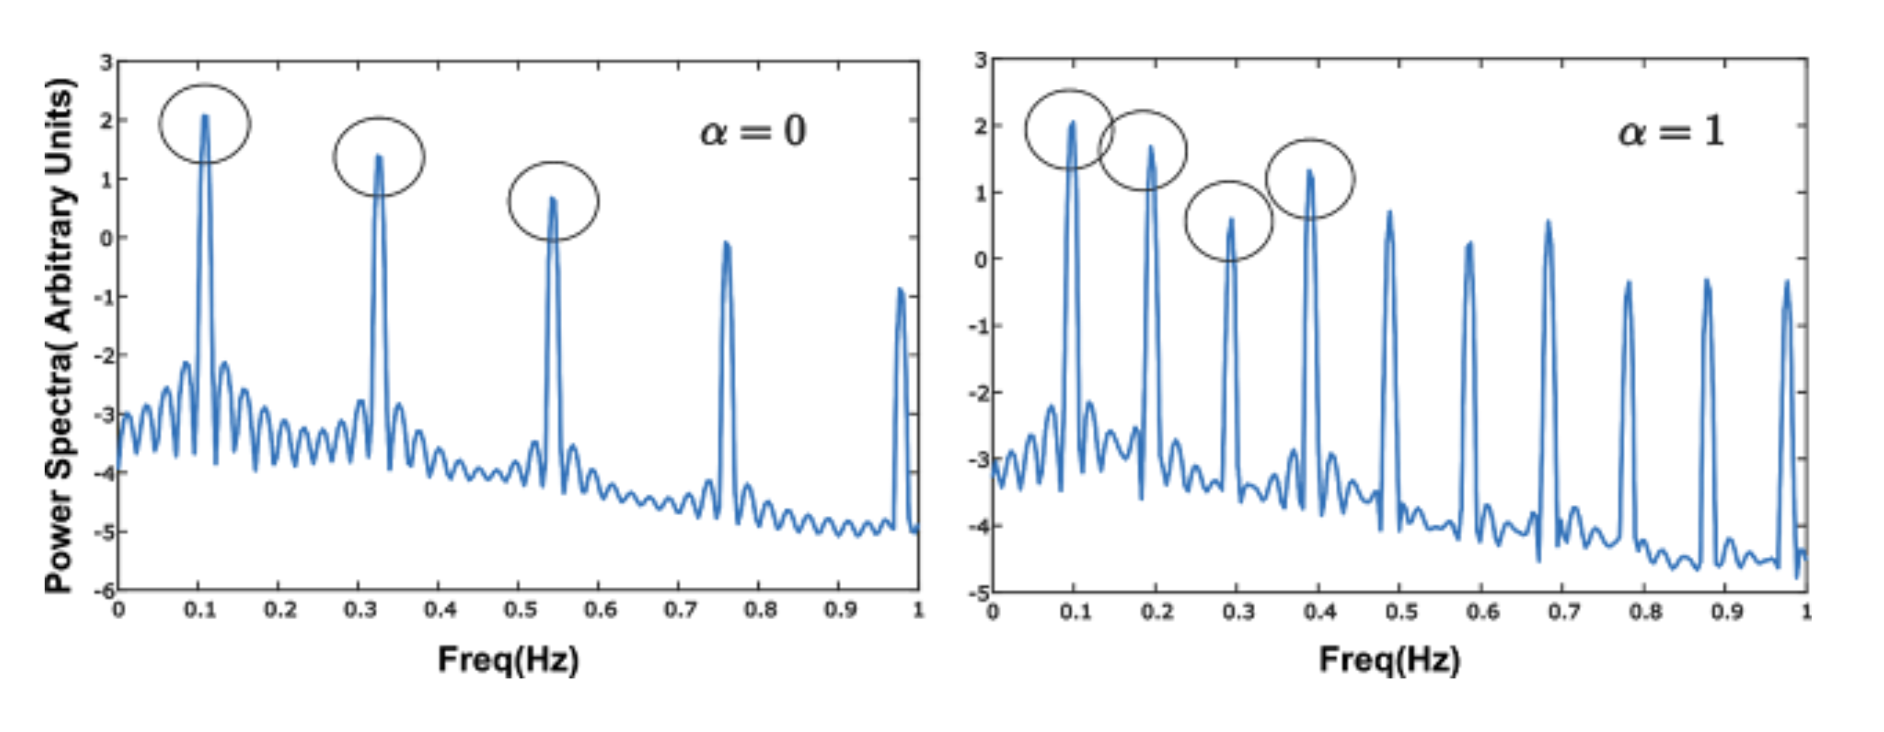
Interestingly, there exists a well-defined relationship between the phases of the harmonics. This relationship can be quantified using the standard technique of bandpass filtering the signal in order to obtain time-series corresponding to individual harmonics and then using the hilbert transform to extract phases-
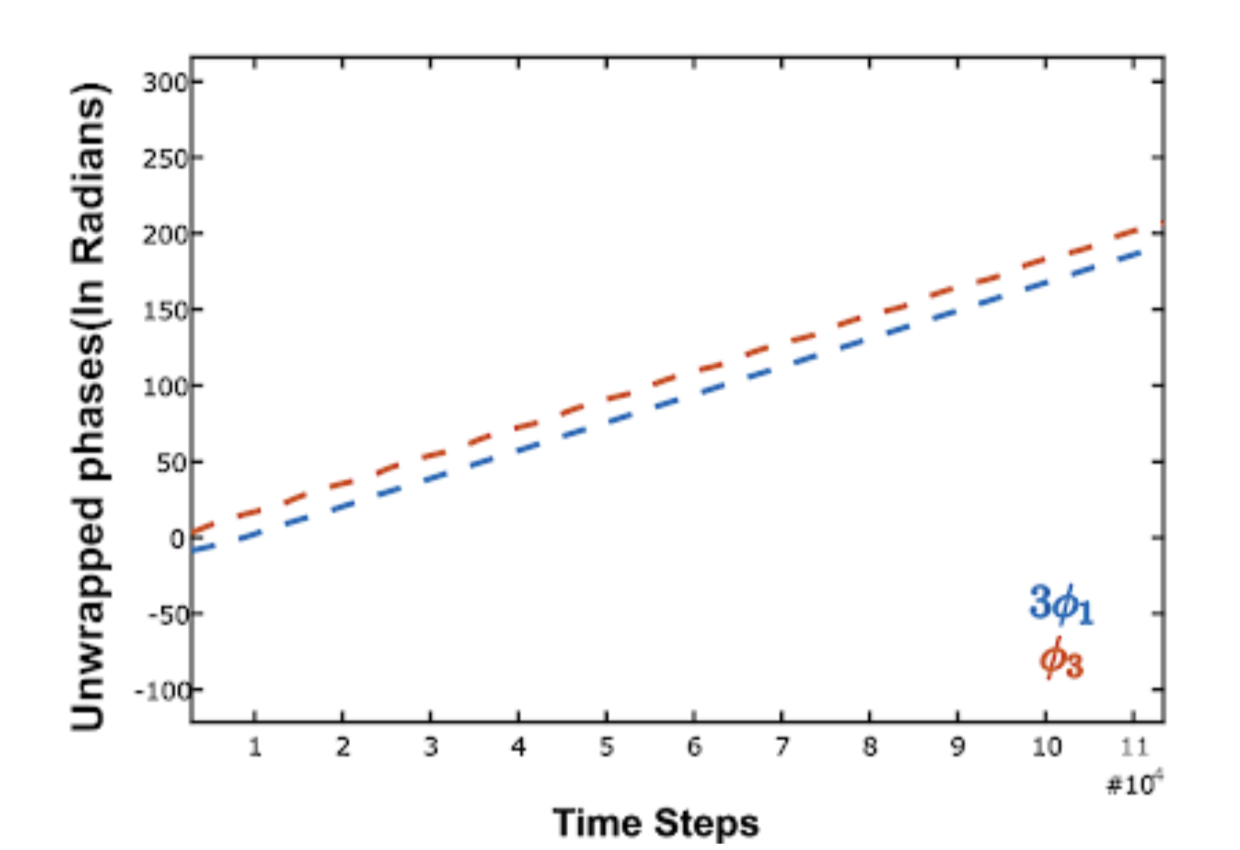
Basically, in our example the oscillator frequency displays a phase locking with its $n^{th}$ harmonic. This type of coupling is also referred as n:m phase locking and has been observed in diverse natural phenomenon. The extent of the coupling can be quantified by studying the statistics of the phase difference using a circular phase histogram-
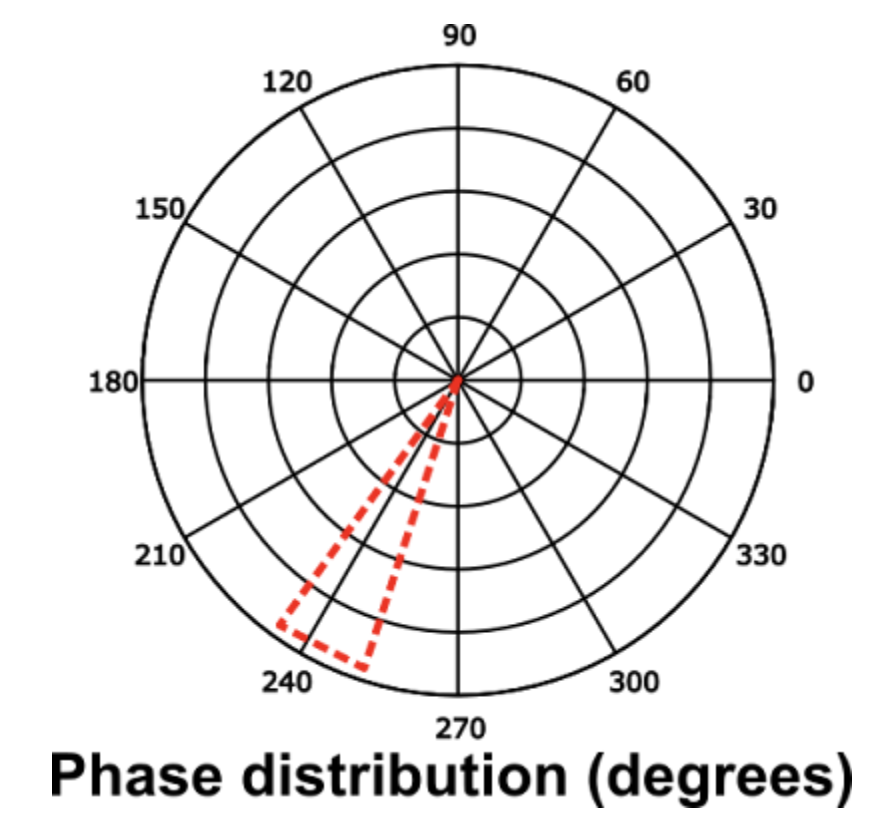
As can be seen, the phase differences cluster in a particular direction instead of being uniformly distributed.